
Home › Forums › TrueRNG Hardware random number generator › TrueRNGPro raw binary mode
This topic contains 6 replies, has 2 voices, and was last updated by Ubld.it Staff 8 years, 1 month ago.
-
AuthorPosts
-
February 7, 2016 at 6:32 am #1584
I have a few questions on the TrueRNGPro raw binary mode:
1. Is the data still sent in 64 byte URBs?
2. What is the effect of the whitening being turned off? What is really happening with whitening being turned on (which algorithm is used)? Answer: I see the FAQ links to a wikipedia article. But this article is a bit general. Why does bias arise technically? Is it a voltage bias?
3. Is there another way to get *synchronous* data of RNG1 and RNG2 without the data being mixed in a single stream?Thanks,
MartinFebruary 7, 2016 at 8:50 am #1587And 4.: Does the raw mode increase data throughput since no more whitening is done in hardware?
February 11, 2016 at 3:24 pm #1594Hi there. So 1 yes it is still sent in 64 byte URBs. 2) The data won’t be whitened, Data shows up in Gaussian distribution and not every bit will have equal entropy. 3) Yes, see the TrueRNGPro additional modes for more documentation on that. 4) Yes, raw mode doesn’t throw away any of the samples as the whitened mode does so it is faster.
February 15, 2016 at 3:03 pm #1599Thanks for your answer.
2 cont.) You said the distribution is Gaussian in raw mode. This means the 8 received 10 Bit values for each RNG within one URB (16 values in total) have a Gaussian distribution considering their decimal values?
5) What exactly is meant by “the data contains a normal amount of ADC bias mostly in the LSB (least significant bit)”? Is this related to the precision of the used ADC in the TrueRNGPro, or is it related to a voltage bias? How does this affect my data in raw mode? Is the LSB not really random?
PS: I ordered my TrueRNGPro. Looking forward to it.
-
This reply was modified 8 years, 2 months ago by
Martin.
February 16, 2016 at 3:15 pm #16028 values is not statistically significant enough to see the distribution. This is a statistical probability distribution and not guaranteed over a finite set of values.
see https://en.wikipedia.org/wiki/Probability_distribution
For the ADC bias, it is bias introduced by the ADC of the micro controller. The entropy of the LSB is reduced by the ADC bias. This is dependent on the internal design of the converter and manufacturing variations. This means that the LSB value is more likely to be either a zero or one depending on a large number of factors.
There are many documents on this topic such as
https://www.maximintegrated.com/en/app-notes/index.mvp/id/748Hope this helps
February 22, 2016 at 5:14 pm #1604I’ve got my TrueRNGPro now and making my first test runs. The whitened modes are running fine with a very high degree of precision if I take a large enough sample.
But I don’t understand the results in raw binary mode. I implemented all the necessary data processing and bit operations to get 10 bit values from the RNGs. I get a mean value of ~477.5 which is not very close to the expected value of 511.5.
Next try was to right shift the 10 bit values by 2 bits to get 8 bit values. By that measure I tried to get rid of ADC bias which should be in the LSBs. Now my mean values are ~119 which is also not very close the the expected value of 127.5 and no quality improvement to the unshifted values.
Also I never get real low or real high values. The bound for the 10 bit values is approx. [140,820]. For the 8 bit values approx. [35,210]. The observed mean values are approximately in the middle of these ranges – so the distributions are likely Gaussian as expected, but with an noticable offset.
Furthermore most of the time the average values from RNG2 are slightly lower than the values from RNG1.
Is this what I should expect to receive in this mode?? I thoroughly tested my data processing and I don’t think there are numerical errors introduced by my code. What would be the recommended way to finally have a Gaussian distribution over 8 bits with a mean of 127.5. I can certainly do a rescaling to of the observed 10 bit range of [140,820] into the range [0,255] but maybe there is a more “correct” way?
February 24, 2016 at 10:19 am #1608Your frequency distribution plot should look about like this. There is some variation due parts tolerances. The mean should be between 400 and 600. The standard deviation should be between 30 and 100 (usually about 50).
If you want the mean to be some other value, you can just subtract to move the distribution to that point to scale by some multiple. By removing the LSB, you get rid of some of the bias (i.e. the “spikes” in the distribution) and scale it by 1/2 so the mean and standard deviation is now 1/2 of what was before.
Here are a couple of our unit tests:
RNG1 Mean: 491.560824 Std Dev: 51.150222 Within Expected Range
RNG2 Mean: 492.534488 Std Dev: 53.114889 Within Expected RangeRNG1 Mean: 480.277512 Std Dev: 46.301158 Within Expected Range
RNG2 Mean: 481.020530 Std Dev: 47.724982 Within Expected Range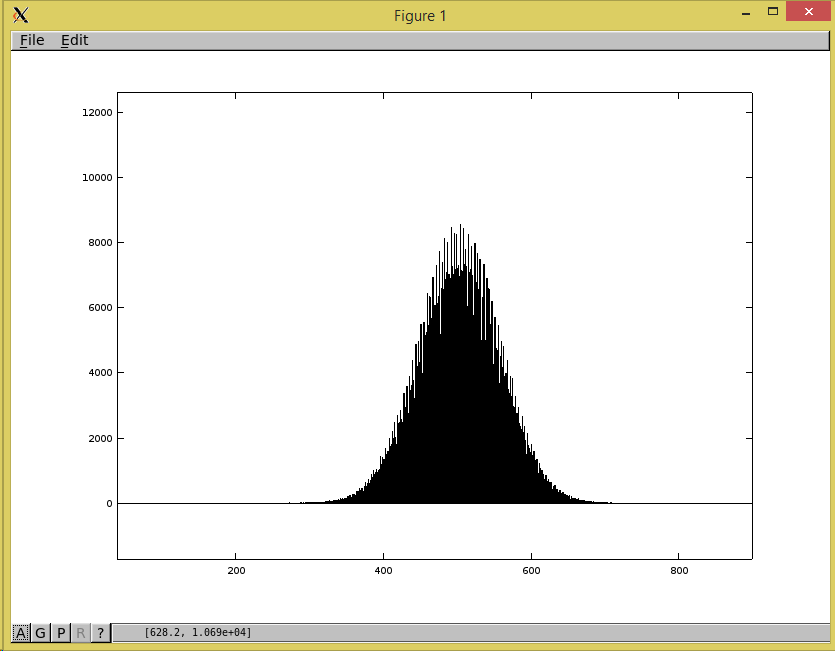
-
This reply was modified 8 years, 2 months ago by
-
AuthorPosts
You must be logged in to reply to this topic.